Context
The client was developing a public analytics offering for experts and a professional audience. Their website needed to regularly publish up-to-date economic indicators, analytical views, charts, and dashboards tracking how key figures change over time.
That required a single system that collects data from many external sources on its own, normalizes it into a consistent format, calculates the required indicators, and hands the finished data to the site's interface.
The source data was spread across 7 external sources, including websites of various organizations and regularly published Excel exports. Most of the sources had no API.
What we owned
NekaSoft owned the backend of the analytics product, from discovery to long-term support. The frontend was built by a separate team, and the calculation methodology was provided by the client's experts; NekaSoft took part in reviewing it and in shaping the indicators, views, and presentation logic.
Discovery
- Discovery and business analysis
- The set of indicators and analytical views
- Review and discussion of the provided calculation methodology
Build
- Backend architecture
- Automated data collection from external websites
- Parsing and processing of Excel exports
- Data normalization and aggregation
- Calculation logic
- REST API for the frontend
Launch
- Deployment assistance
Support
- Ongoing support and development
Solution
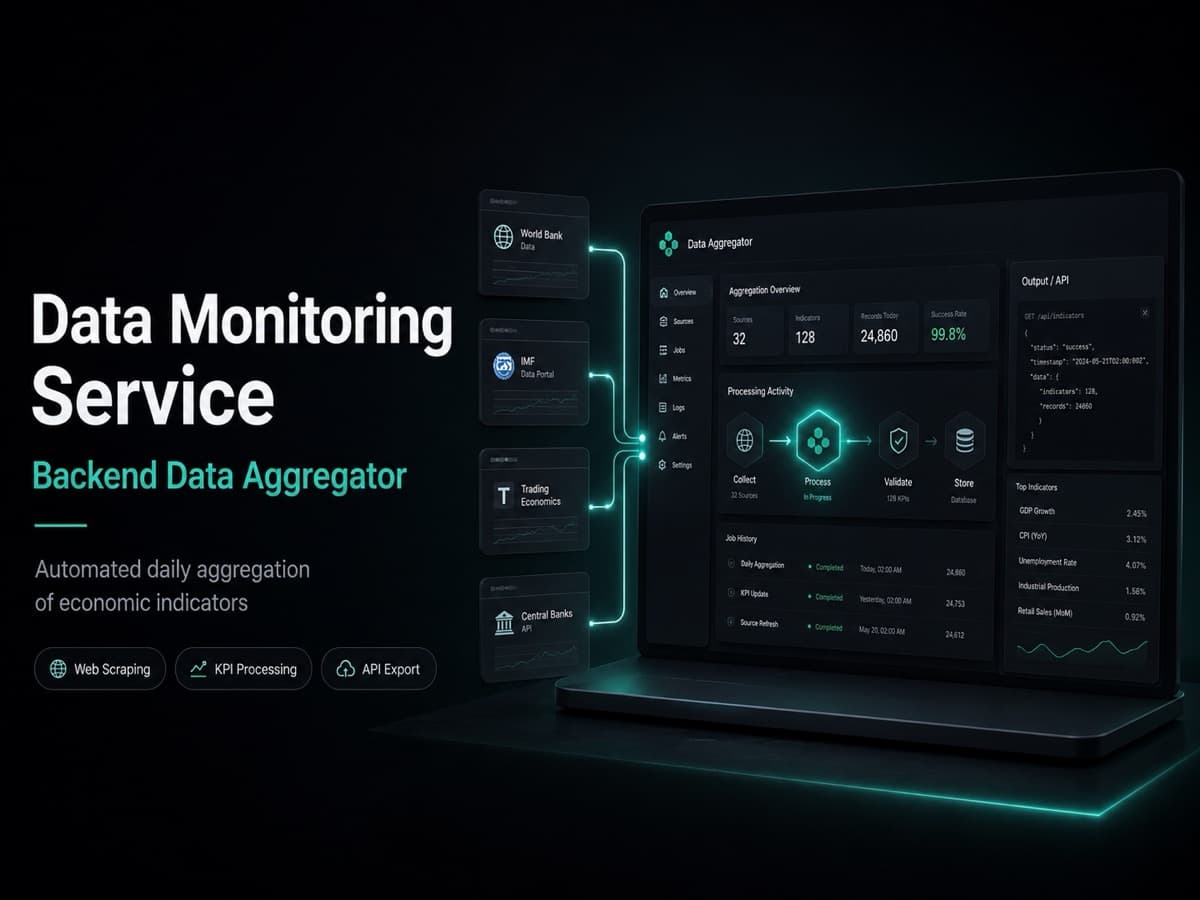
The visible part of the product is the charts and dashboards on the client's site. Behind them runs a pipeline that turns scattered external data into calculated indicators.
- Automated browser-based collection with Selenium for sources without an API
- A dedicated module that parses Excel exports with a complex structure, finding the right tables, rows, and values
- Normalization of all incoming data to a single internal structure
- Aggregation across all 7 sources and calculation of around 50 indicators and views
- Results stored in PostgreSQL and served to the frontend over a REST API
- A full refresh cycle running automatically 4 times a month
- New indicators and reports added as the product grows
The value is not in reading individual pages. It is in the full pipeline: scattered sources without an API and unstable formats on one side, and comparable, regularly updated economic indicators ready for public dashboards on the other.
Screenshots
Result
The system became the data backbone of the client's public analytics product.
- Data collection automated across 7 external sources
- Both web sources and Excel exports are handled
- Around 50 indicators and analytical views are calculated
- A single backend for collection, normalization, aggregation, and calculations
- REST API for frontend integration
- Data refreshes automatically 4 times a month
- New indicators and reports can be added as the analytics product grows
Delivery
The first working version of the system took about a month and a half.
The service has been in production for 4 years and is still supported by NekaSoft: the team has adapted collection to changes in the external sources, refined the calculation logic, and added new analytical reports.
Technology
The backend is NekaSoft's work: collection, parsing, normalization, calculations, and the REST API. The frontend was built by a separate team, and the calculation methodology came from the client's experts, with NekaSoft taking part in its review.
Is the data your product needs scattered across sources that were never designed to be integrated?